Hear when we ship something useful
A short email when we ship something useful for shop-floor teams.
You can unsubscribe anytime. By subscribing you agree to our Privacy Notice.
Non-conformances follow the 8D structure through to a closed, signed record.
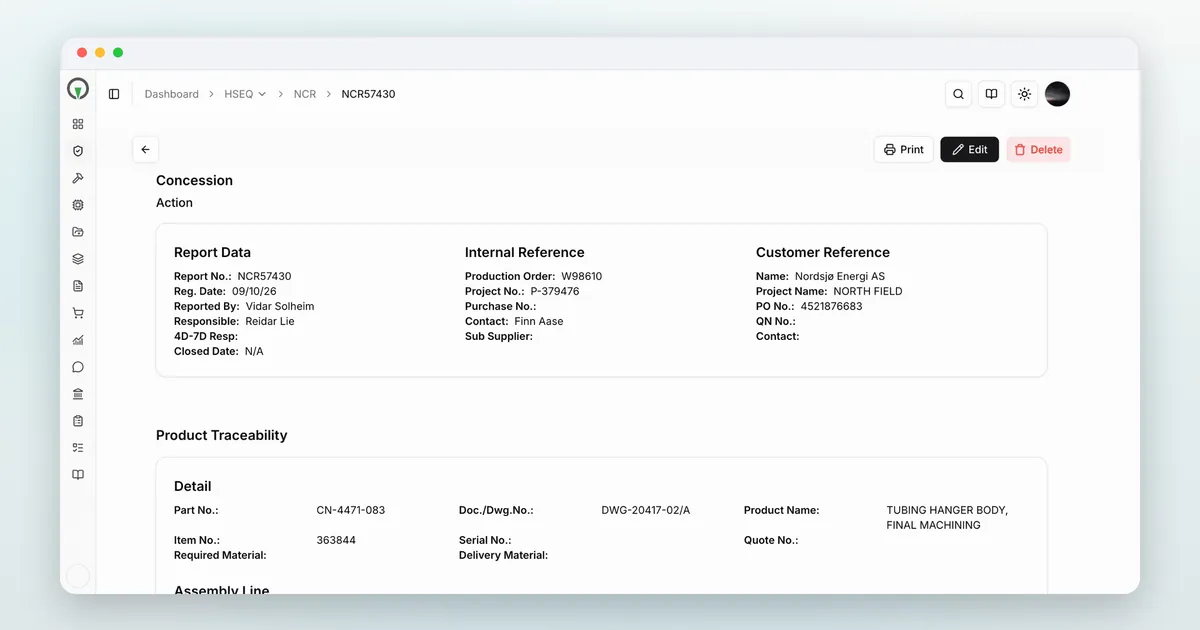
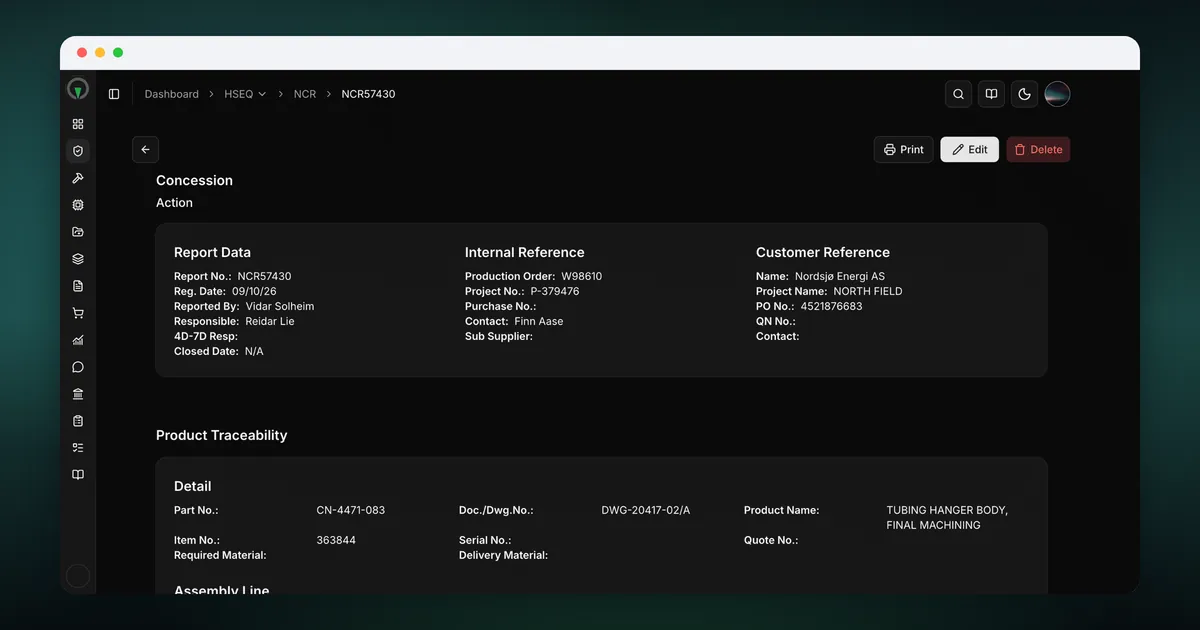
A customer's quality auditor asks for the corrective action record on a non-conformance raised eight months ago, against a casting they took delivery of. The item, the order and the people involved are already in Business Central. HSEQ keeps the report on the casting's own page: eight tabs, dated entries, the signed approval, and the corrective action that closed it out.
NCR
Visual Tracking NCR keeps nonconformities, responsible people and supporting evidence connected.
How does your team know which quality actions remain open?
How it works in Visual Tracking
A tabbed 8D form, with the tabs that do not apply to the chosen Level struck through: selecting the item pulls drawing, revision, customer and contact, the containment tab handles the customer loop from suggested action to signed-off performed action, the root-cause tab holds five dated whys and a three-level cause hierarchy, and closing is gated on containment, discovery and, at the deepest level, root cause and corrective action. Every report totals its hours and material cost, an open NCR badges its item and order wherever they appear, and an auditor receives a signed PDF with the dates intact.
Root Cause
Visual Tracking Root Cause charts nonconformities by root-cause type over time, so a recurring cause is visible before the next audit asks about it.
How much manual analysis does your team need before a quality trend becomes a management discussion?
How it works in Visual Tracking
Three KPI cards for the period, total NCRs, top root cause and peak month, above a line chart of NCR volume per root-cause type by month and a donut of the distribution. Filter by date range, type and project, toggle a cause from the legend, and click a segment to open the NCRs behind it.
Event Discovery
Visual Tracking Event Discovery shows where nonconformities are caught, from incoming inspection to the customer, and the cost carried at each discovery point.
How often is a defect discovered late, and how often does the customer find it first?
How it works in Visual Tracking
Every NCR records where it was discovered on three levels, from NCR type down to the specific discovery point; the dashboard starts with one bar per type and drills down level by level to the NCR list behind a bar. NCRs with no discovery recorded yet stay visible as an Unknown bar, so the total cost always equals the sum of the bars.
Each closed NCR is also ISO 9001 evidence. See what Visual Tracking records against each ISO 9001 clause.
An NCR is raised straight from an operation, pre-filled with the production order, and badges it.
A supplier non-conformance links to the purchase order and badges it across the purchase views.
Operator-filled inspection reports sit alongside the NCR for the same work.
Book a meeting and we will look at how non-conformances are handled today, then show the 8D capture and the Root Cause dashboard that keep the same defect from coming back. If it is not a fit, we will say so.
A short email when we ship something useful for shop-floor teams.
You can unsubscribe anytime. By subscribing you agree to our Privacy Notice.